Template gallery / chart-card
chart-card
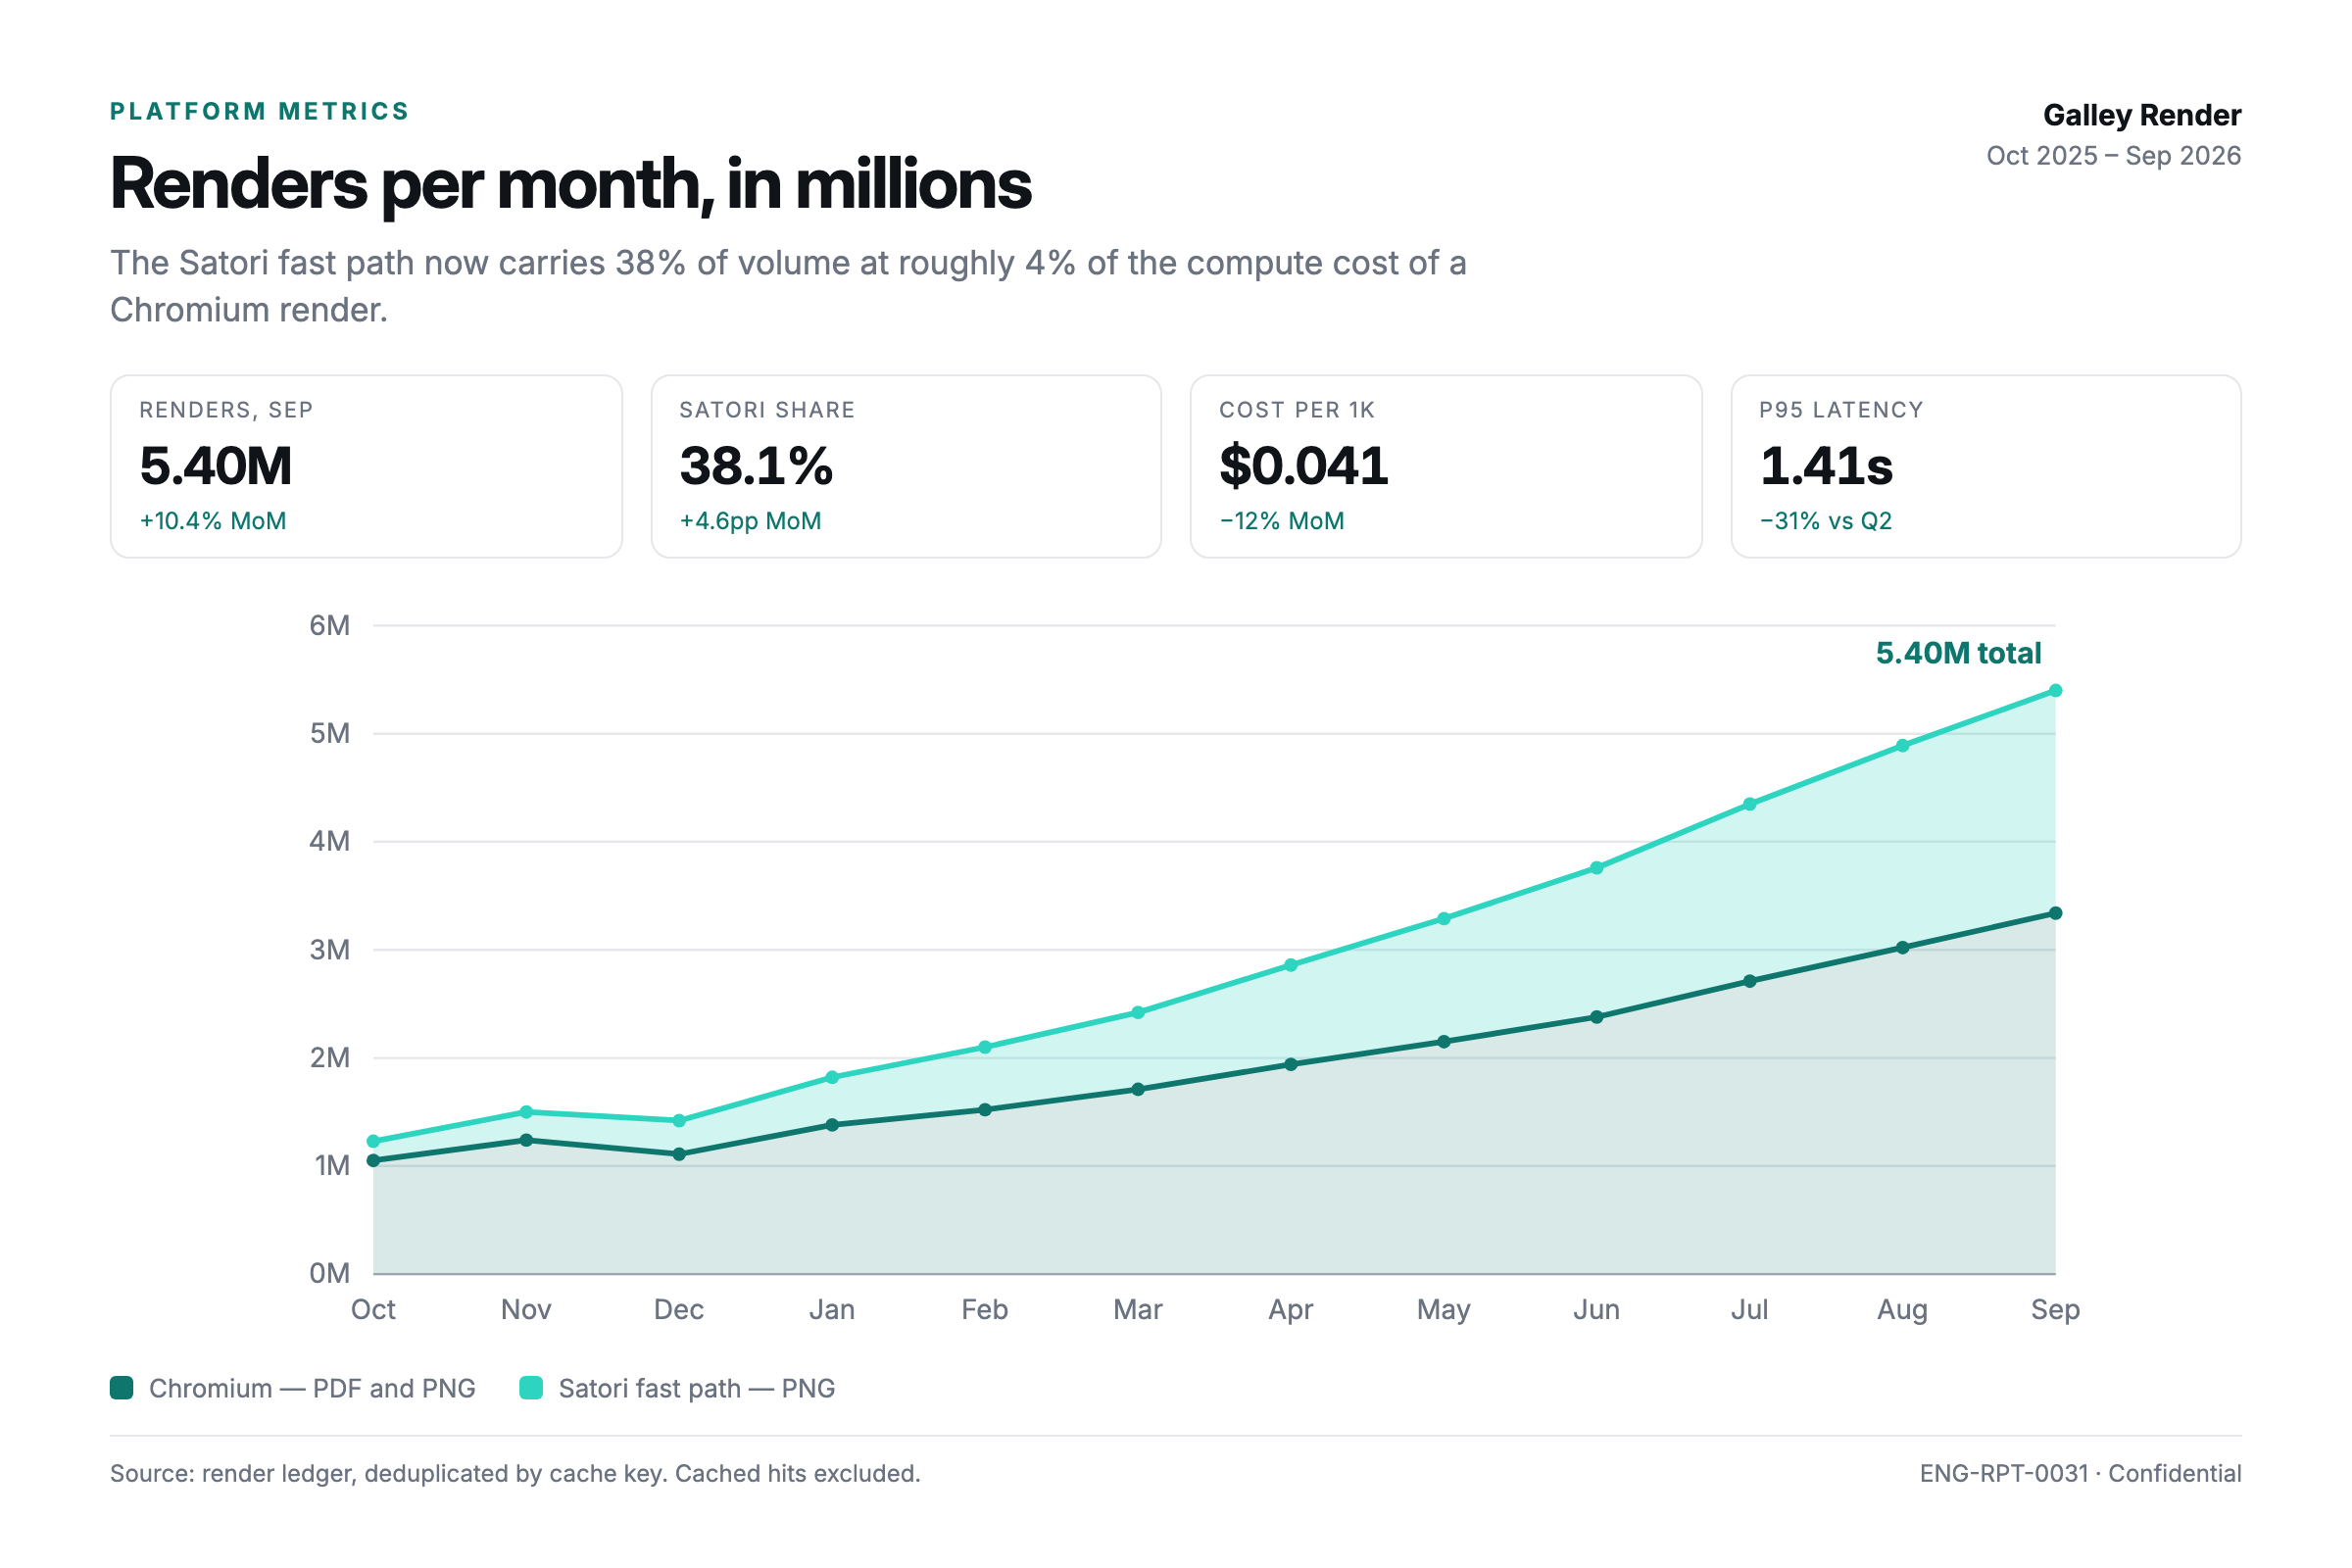
1200x800 chart card that takes a ready-made SVG string. The card supplies the frame — eyebrow, title, KPI strip, legend, source line — and the SVG is dropped in unescaped and scaled to the plot area.
chromium default PDF 15 top-level fields 1 unit per page
Fields
The full JSON Schema is below. Required fields are marked; anything missing comes back as a 422 naming the path, the expected type and a value that would be accepted.
| Field | Type | Required | Description |
|---|---|---|---|
| chart_svg | string | required | A complete <svg> element as a string. Give it a viewBox and no fixed width/height so it scales to the plot area; it is inserted unescaped, so send SVG you trust. Fonts must be generic families — the card has no network access. |
| title | string | required | |
| subtitle | string | optional | |
| eyebrow | string | optional | |
| organization | string | optional | |
| period | string | optional | |
| source | string | optional | |
| note | string | optional | |
| accent | string | optional | |
| background | string | optional | |
| text_color | string | optional | |
| muted_color | string | optional | |
| rule_color | string | optional | |
| kpis | array of object { label, value, delta, direction } | optional | |
| legend | array of object { label, color } | optional | Drawn by the card, under the plot, so the SVG does not have to carry one. |
Default render options
Applied unless you override them. Options are part of the cache key.
| width | 1200 |
| height | 800 |
| print_background | true |
Example payload
This exact object renders the preview above. It is also what the API echoes back in a validation error, so an agent can repair a payload without a round trip to the docs.
{
  "eyebrow": "Platform metrics",
  "title": "Renders per month, in millions",
  "subtitle": "The Satori fast path now carries 38% of volume at roughly 4% of the compute cost of a Chromium render.",
  "organization": "Galley Render",
  "period": "Oct 2025 – Sep 2026",
  "chart_svg": "<svg viewBox=\"0 0 800 330\" xmlns=\"http://www.w3.org/2000/svg\" font-family=\"Inter, Helvetica, Arial, sans-serif\"><line x1… [4,823 characters, shortened for display]",
  "kpis": [
    {
      "label": "Renders, Sep",
      "value": "5.40M",
      "delta": "+10.4% MoM",
      "direction": "up"
    },
    {
      "label": "Satori share",
      "value": "38.1%",
      "delta": "+4.6pp MoM",
      "direction": "up"
    },
    {
      "label": "Cost per 1k",
      "value": "$0.041",
      "delta": "−12% MoM",
      "direction": "up"
    },
    {
      "label": "p95 latency",
      "value": "1.41s",
      "delta": "−31% vs Q2",
      "direction": "up"
    }
  ],
  "legend": [
    {
      "label": "Chromium — PDF and PNG",
      "color": "#0f766e"
    },
    {
      "label": "Satori fast path — PNG",
      "color": "#2dd4bf"
    }
  ],
  "source": "Source: render ledger, deduplicated by cache key. Cached hits excluded.",
  "note": "ENG-RPT-0031 · Confidential",
  "accent": "#0f766e"
}
Values longer than 240 characters — data URIs, inline SVG — are shortened here so the
shape of the payload stays readable, and the replacement says how much was left out.
get_template and GET /v1/templates/:ref return them in full.
Render it
curl -sS https://api.galleyrender.com/v1/render \
  -H "Authorization: Bearer $GALLEY_API_KEY" \
  -H 'content-type: application/json' \
  -d '{
  "template": "chart-card@1",
  "format": "pdf",
  "data": "… the example payload above …"
}'# No API key. The first call mints a 50-render trial.
curl -sS https://mcp.galleyrender.com/mcp \
-H 'content-type: application/json' \
-H 'accept: application/json, text/event-stream' \
-d '{
"jsonrpc": "2.0",
"id": 1,
"method": "tools/call",
"params": {
"name": "render",
"arguments": {
"template": "chart-card",
"format": "pdf",
"data": { … see the example payload above … }
}
}
}'
Pin the version — chart-card@1 — in anything you ship. Publishing a new
version never changes an old one. Render endpoint reference →
Renders the example payload on the production service. No account, no key.
JSON Schema
schema.json (15 top-level properties)
{
  "$schema": "https://json-schema.org/draft/2020-12/schema",
  "title": "Chart card",
  "description": "A 1200x800 card that frames a chart you have already rendered to SVG. Galley does not plot the data — build the SVG with your own charting library (D3, Vega, matplotlib's SVG backend, Chart.js server-side) and pass it as a string.",
  "type": "object",
  "required": [
    "title",
    "chart_svg"
  ],
  "additionalProperties": true,
  "properties": {
    "chart_svg": {
      "type": "string",
      "description": "A complete <svg> element as a string. Give it a viewBox and no fixed width/height so it scales to the plot area; it is inserted unescaped, so send SVG you trust. Fonts must be generic families — the card has no network access.",
      "examples": [
        "<svg viewBox=\"0 0 800 320\" xmlns=\"http://www.w3.org/2000/svg\"><polyline fill=\"none\" stroke=\"#0f766e\" stroke-width=\"3\" points=\"0,300 200,180 400,120 600,90 800,40\"/></svg>"
      ]
    },
    "title": {
      "type": "string",
      "examples": [
        "Renders per month, in millions"
      ]
    },
    "subtitle": {
      "type": "string",
      "examples": [
        "The Satori fast path now carries 38% of volume at 4% of the compute cost."
      ]
    },
    "eyebrow": {
      "type": "string",
      "examples": [
        "Platform metrics"
      ]
    },
    "organization": {
      "type": "string",
      "examples": [
        "Galley Render"
      ]
    },
    "period": {
      "type": "string",
      "examples": [
        "Oct 2025 – Sep 2026"
      ]
    },
    "source": {
      "type": "string",
      "examples": [
        "Source: render ledger, deduplicated by cache key."
      ]
    },
    "note": {
      "type": "string",
      "examples": [
        "ENG-RPT-0031 · Confidential"
      ]
    },
    "accent": {
      "type": "string",
      "examples": [
        "#0f766e"
      ]
    },
    "background": {
      "type": "string",
      "examples": [
        "#ffffff"
      ]
    },
    "text_color": {
      "type": "string",
      "examples": [
        "#101418"
      ]
    },
    "muted_color": {
      "type": "string",
      "examples": [
        "#6b7280"
      ]
    },
    "rule_color": {
      "type": "string",
      "examples": [
        "#e5e7eb"
      ]
    },
    "kpis": {
      "type": "array",
      "maxItems": 5,
      "items": {
        "type": "object",
        "required": [
          "label",
          "value"
        ],
        "properties": {
          "label": {
            "type": "string",
            "examples": [
              "Renders, Sep"
            ]
          },
          "value": {
            "type": "string",
            "examples": [
              "5.4M"
            ]
          },
          "delta": {
            "type": "string",
            "examples": [
              "+18% MoM"
            ]
          },
          "direction": {
            "type": "string",
            "enum": [
              "up",
              "down"
            ],
            "default": "up",
            "examples": [
              "up"
            ]
          }
        }
      }
    },
    "legend": {
      "type": "array",
      "description": "Drawn by the card, under the plot, so the SVG does not have to carry one.",
      "items": {
        "type": "object",
        "required": [
          "label",
          "color"
        ],
        "properties": {
          "label": {
            "type": "string",
            "examples": [
              "Chromium — PDF"
            ]
          },
          "color": {
            "type": "string",
            "examples": [
              "#0f766e"
            ]
          }
        }
      }
    }
  }
}